

Key Takeaways:
- The national office vacancy rate was close to 19.4% in July, following an increase of nearly 130 basis points year-over-year.
- The national office listing rate averaged $32.72 per square foot in July, which marked a 3.3% increase from the previous year.
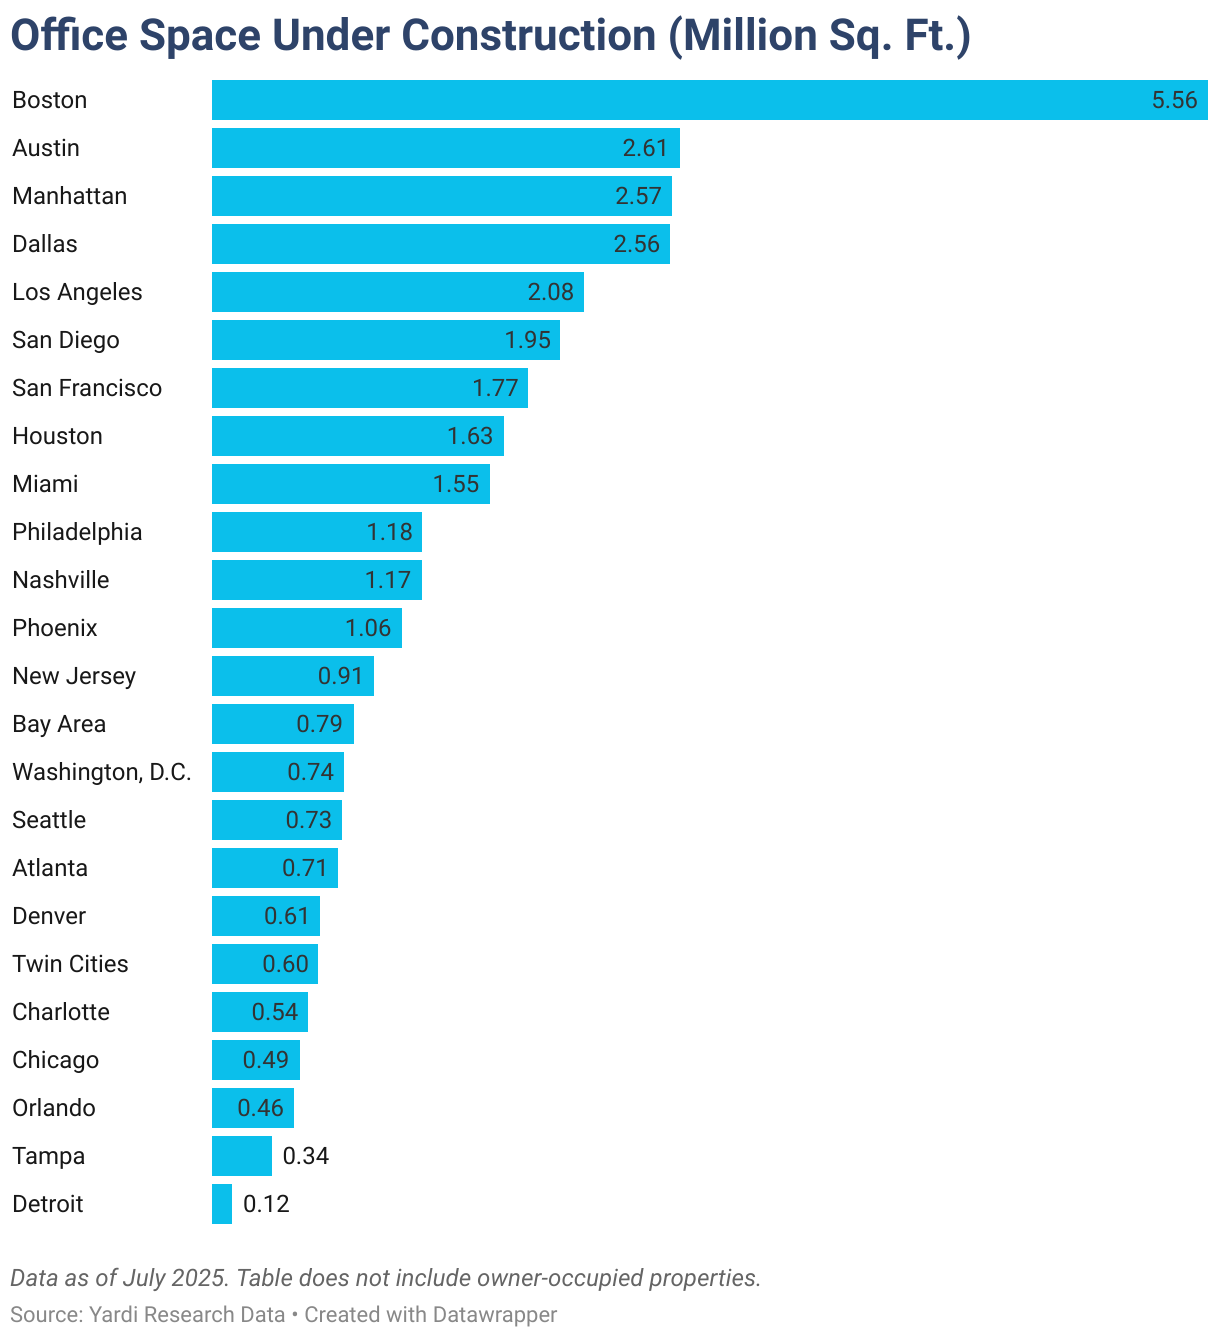
- With a little more than 40 million square feet of office space currently under construction, the office supply pipeline remained modest at the start of August.
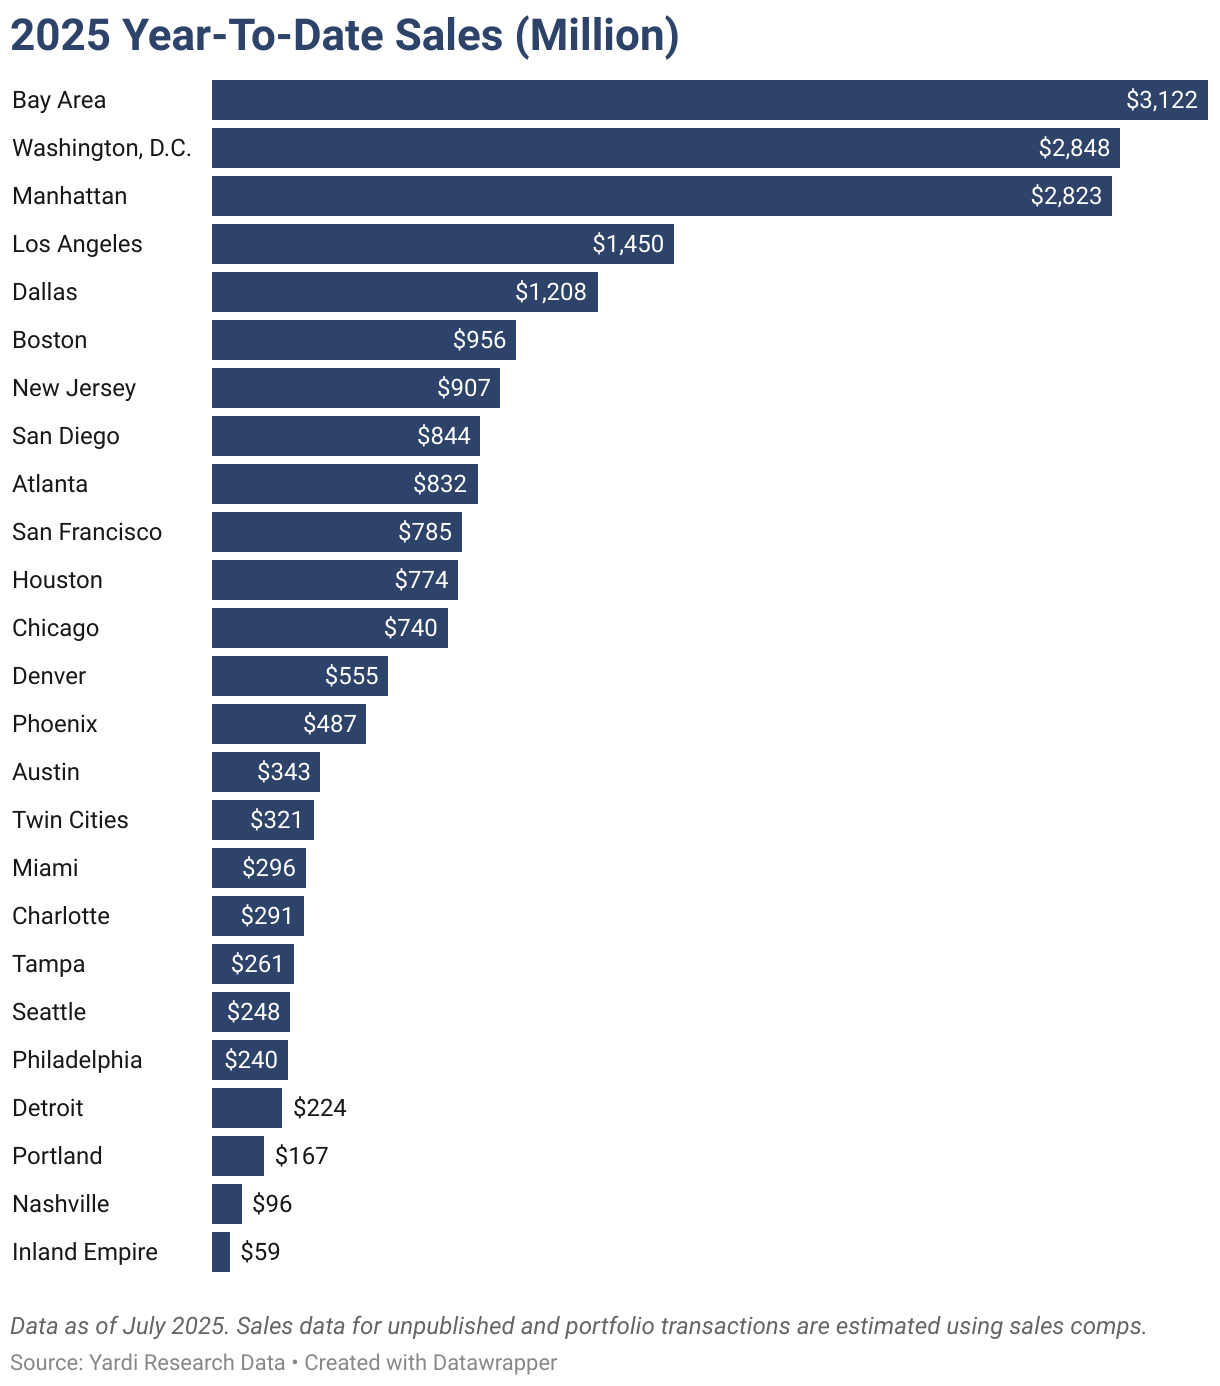
- The Bay Area topped the list for YTD sales through July in terms of dollar volume (roughly $3.4 billion), followed closely by Washington, D.C. ($3.3 billion).
- Austin, Texas, and Seattle contended for the highest vacancy rate in July, each at around 27%.
- Office asking rates in Manhattan, N.Y., were roughly double the national average, while Midwestern markets remained among the most affordable.
- Boston remains the most active market in terms of pipeline with nearly 5.6 million square feet of new office space under construction.
Trends & Industry News
Ongoing Office Sector Challenges Nudge Sale Prices Further Down
Demand for office space remains relatively weak, interest rates remain high, and loan maturities are peaking. In this context, loan extensions are likely to diminish and lenders less likely to extend loans for underperforming assets, which can cause property prices to drop even further. In turn, this can create a wave of opportunities for office investors, as well as possibly result in some slightly less-costly property conversions.
“There has been a recalibration of office values, and that in turn has created an opportunity for investors who see value, as well as a point of entry for those with more ambitious plans that are looking to redevelop or repurpose.”
Peter Kolaczynski, Director, Yardi Research
Yardi Research data showed that more than 3,200 office properties with two or more historical sales had changed hands since the start of 2023. And, of those, more than 42% were traded at a lower value than their previous sale. The office markets with the highest percentages of discounted sales were Houston (69%); San Francisco (67%); Manhattan, N.Y. (64%); Washington, D.C. (64%); and Dallas (61%).
Notably, sales closed since the start of 2023 showed that 71% of class A or A+ properties had prices declined from their previous sale, compared to only 38% of B-rated properties and 19% of C-rated properties. This was also consistent across the central business district (CBD) versus suburban sales breakdown. Specifically, 70% of office properties located in CBDs — where there tends to be the highest concentration of class A and A+ buildings — have sold at a discount since 2023. During that same time, urban areas outside of the city center saw about 45% of properties selling at a discount. Since 2023, only 39% of suburban properties have sold for a lower-than-previous price.
Listing Rates & Vacancy
Austin, Texas, Remains Among Top Office Markets, Despite Sustained Hike in Vacancy
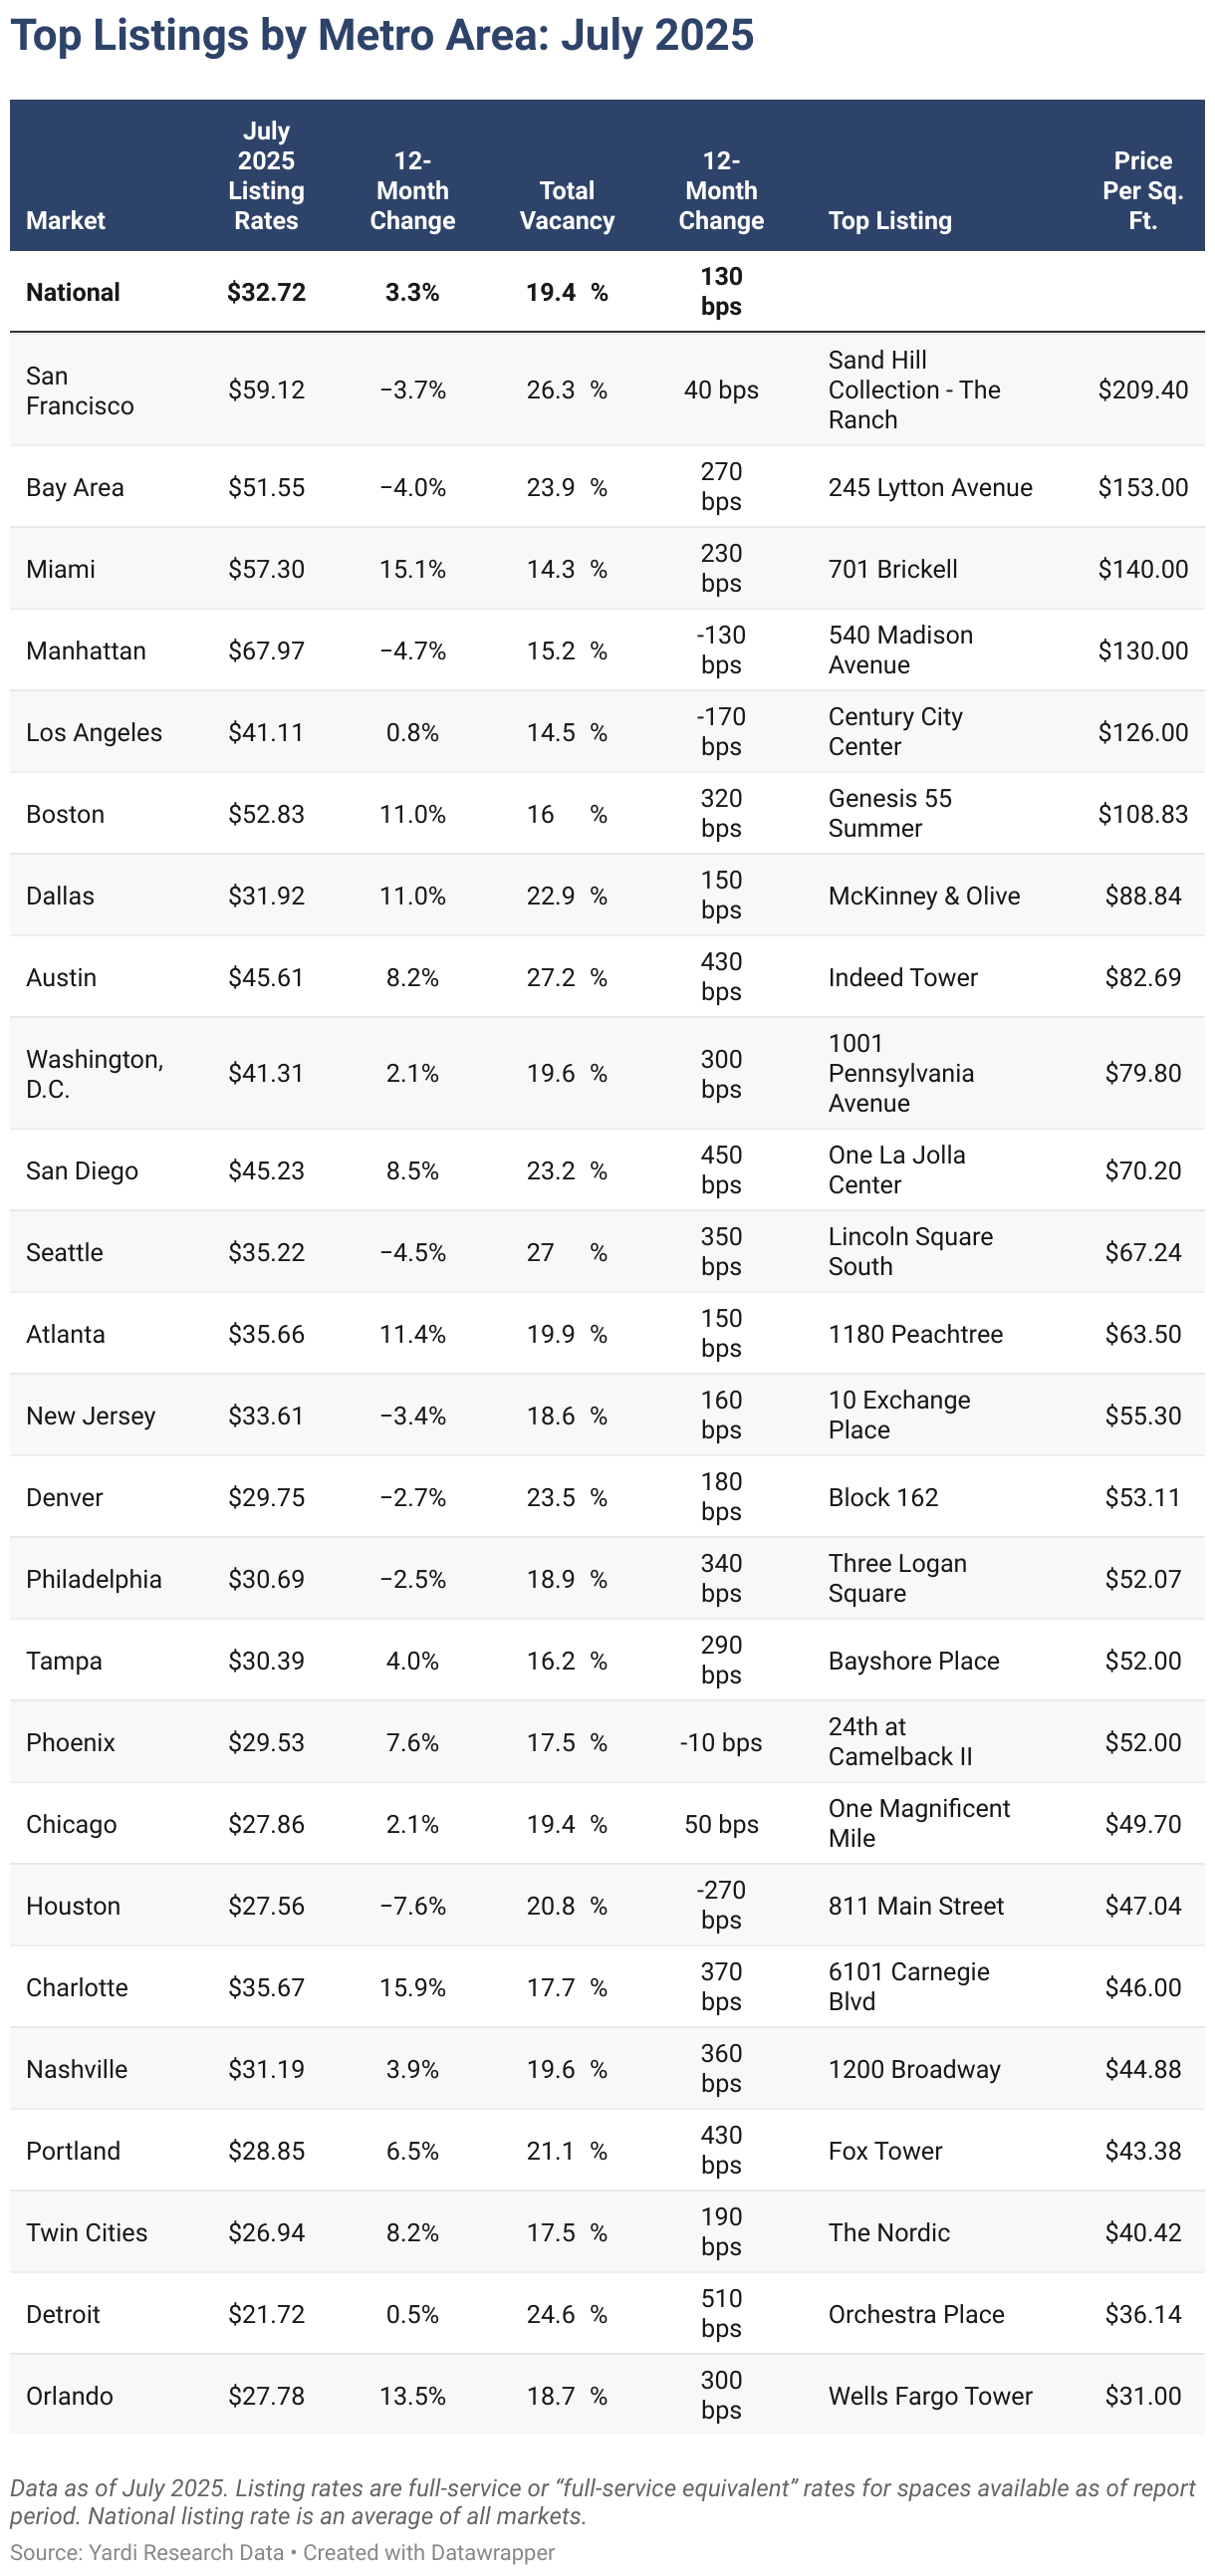
The national average full-service equivalent listing rate for office space was $32.72 per square foot in July, which marked an increase of 3.3% year-over-year (Y-o-Y). Meanwhile, the national vacancy rate inched up 130 basis points (bps) over the previous year to reach 19.4% last month.
Zooming in on Austin, Texas, vacancy rates increased 430 bps in the last 12 months. At the same time, office space in Austin was more than 27% vacant in July as the effect of new supply and the shift toward hybrid and remote work outweighed the market’s relatively strong utilization and solid employment growth in recent years.
Granted, the Texas market added 14.3 million square feet of new space (nearly 15% of stock) since 2020 — an expansion that would have been difficult to absorb even with the office utilization levels prior to the start of the decade. However, despite physical office occupancy that’s still significantly below pre-pandemic levels, available office utilization metrics all show Austin as a top market.
Transactions
Office Sales Pick Up Y-o-Y, Phoenix Sees Long-Awaited Price Growth
During the first half of 2025, office sales totaled $25 billion, which was an $8.7 billion increase from the first half of 2024. Then, year-to-date sales in July reached nearly $27 billion with office properties changing hands for an average of $182 per square foot.
The Bay Area; Washington, D.C.; and Manhattan, N.Y., topped the list of markets for year-to-date sales totals in July. Among the top U.S. markets we analyzed for this report, they were also the only ones to surpass $3 billion in office properties traded since the start of the year.
It’s worth noting that Phoenix saw its first increase in sales price per square foot in more than three years: The average sale price of an office property here went from $165 per square foot in 2024 to $197 in 2025. Based on the 34 properties sold for a published transaction amount and with a history of two or more sales, only seven traded at a discount to their previous sale price. And, in terms of year-to-date transactions, sales only totaled $487 million to place Phoenix in the middle of the pack for the year.
Supply
Sizeable Project Starts Make Splash in Manhattan Office Pipeline
As of July, there was a little more than 40 million square feet of office space under construction across major U.S. markets. According to Yardi Research data, this represented less than 1% of national stock and shows the persistence of the substantial slowing of the new-construction pipeline.
Even so, there were a few markets that saw an increase in square footage totals under construction in July, compared to the previous month. Among them, Manhattan, N.Y., had the largest spike in development activity by far, going from 1.56 million square feet under construction in June to 2.57 million square feet of non-owner-occupied office space under construction in July. Sizeable projects such as Related Cos.’ and Oxford Properties’ 1.1-million-square-foot 70 Hudson Yards and BXP’s 930,000-square-foot tower at 343 Madison Ave. will immediately make a splash in such a slow supply pipeline, even in the largest office market in the country.
Western Markets
San Francisco Office Rents & Vacancy Both Remain High
Vacancy rates remained above the national average of 19.4% in most of the Western U.S. markets we surveyed for this U.S. office markets report. More precisely, in July, the highest vacancy rate in the region was in Washington state, where 27% of office space in Seattle was unoccupied. San Francisco wasn’t far behind, however, as data showed a little more than 26% of office space in the market was vacant last month.
Meanwhile, Phoenix office space clocked in below the national average with the vacancy rate here reaching roughly 17.5% in July after a slight dip of 10 bps Y-o-Y.
Not to be outdone, San Francisco and the Bay Area dominated the region in terms of office asking rates in July, each commanding an average of more than $50 per square foot. Office space in San Francisco was the priciest last month with asking rates here averaging a little more than $59 per square foot, whereas, in the Bay Area nearby, office space asked an average of nearly $52 per square foot.
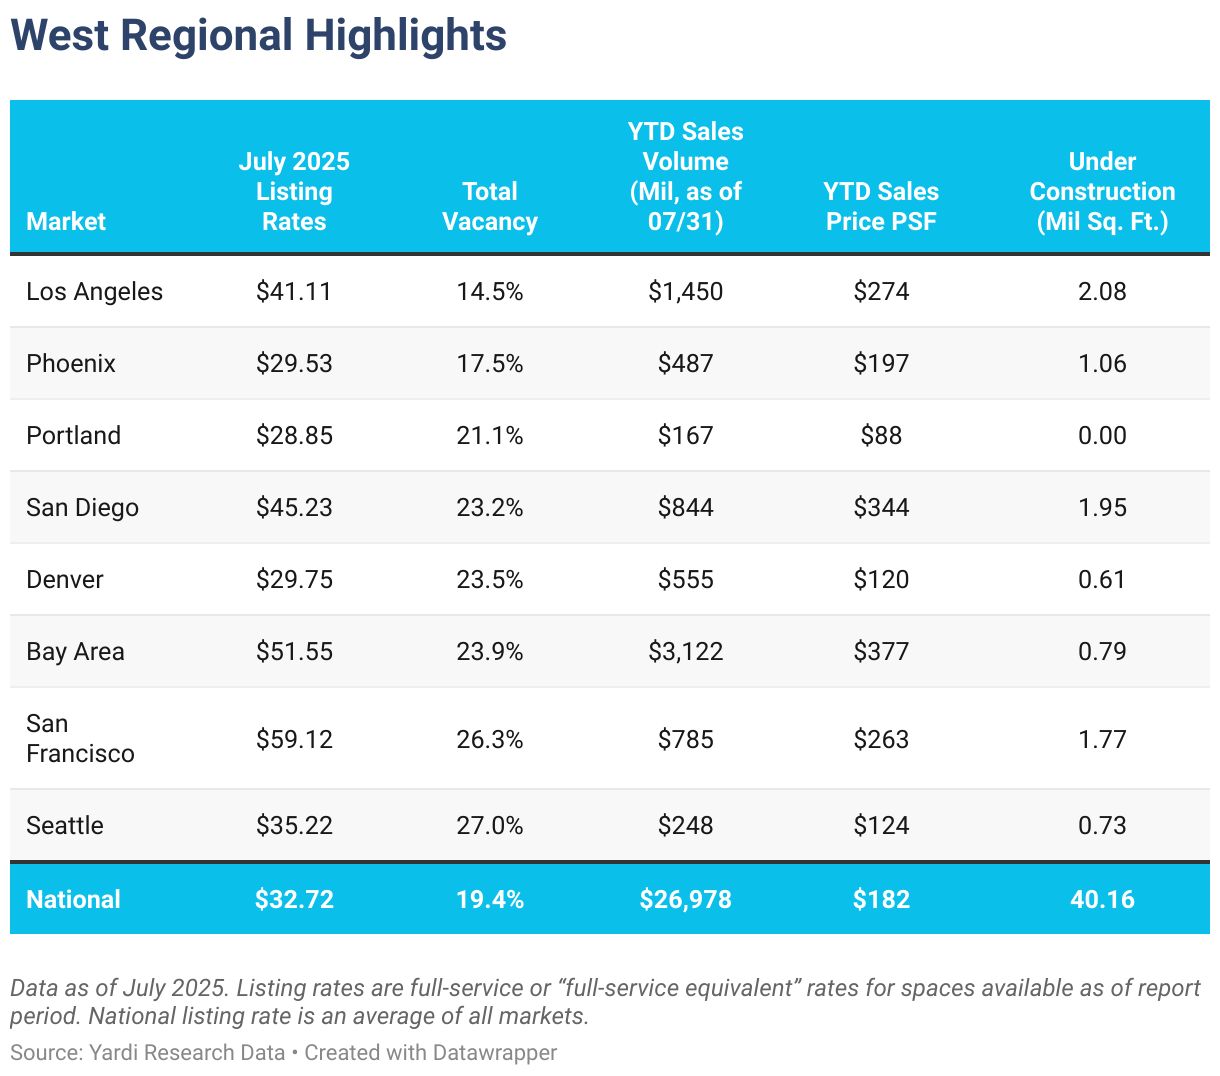
Otherwise, Denver; Phoenix; and Portland, Ore., were the only large markets in the Western U.S. region where office space asking rates were less than the national average of $32.72 per square foot. Portland office space was the most affordable of the group (just below $29 per square foot). However, Phoenix wasn’t too far ahead as the average in July here rested just above $29 per square foot. At the same time, Denver office space asked for close to $30 per square foot, on average.
The Bay Area also held a top position in the region in terms of office sales with year-to-date transactions here adding up to a little more than $3.4 billion. Los Angeles ($1.6 billion in 2025 office sales through July) and San Francisco ($1.2 billion) were the only other markets in the region to see 2025 transaction totals above the $1 billion mark as of July.
The largest office sales price per square foot among the Western U.S. markets we analyzed were in the Bay Area ($372), followed by San Diego ($344 per square foot). Then, Denver, Seattle, and Portland were the only markets in the region where office properties sold for below the national average of $182 per square foot.
Looking at office space currently under construction, we found four Western markets with more than 1 million square feet in development: Los Angeles (2.1 million), San Diego (nearly 2 million underway), San Francisco (roughly 1.8 million), and Phoenix (a little more than 1 million square feet).
Midwestern Markets
Chicago Office Sales Surpass $1B YTD, Asking Rents Inch Up Y-o-Y
Office space in the top Midwestern U.S. office markets we analyzed remained some of the most affordable in the country in July, both in terms of sale price per square foot and listing rents.
Sales closed in Chicago since the start of the year surpassed the $1 billion mark in July with office space here trading for an average of $61 per square foot — the lowest among large markets in the Midwest. Although sales in Detroit and the Twin Cities showed pricier averages, their transaction totals were significantly lower than Chicago, which also led in terms of listing rates.
Specifically, asking rates for office space in Chicago rested at nearly $28 per square foot in July after a modest 2.13% Y-o-Y increase. For comparison, Minneapolis-St. Paul office listing rates last month averaged roughly $27 per square foot, while Detroit office space asked an average of nearly $22 per square foot to rent.
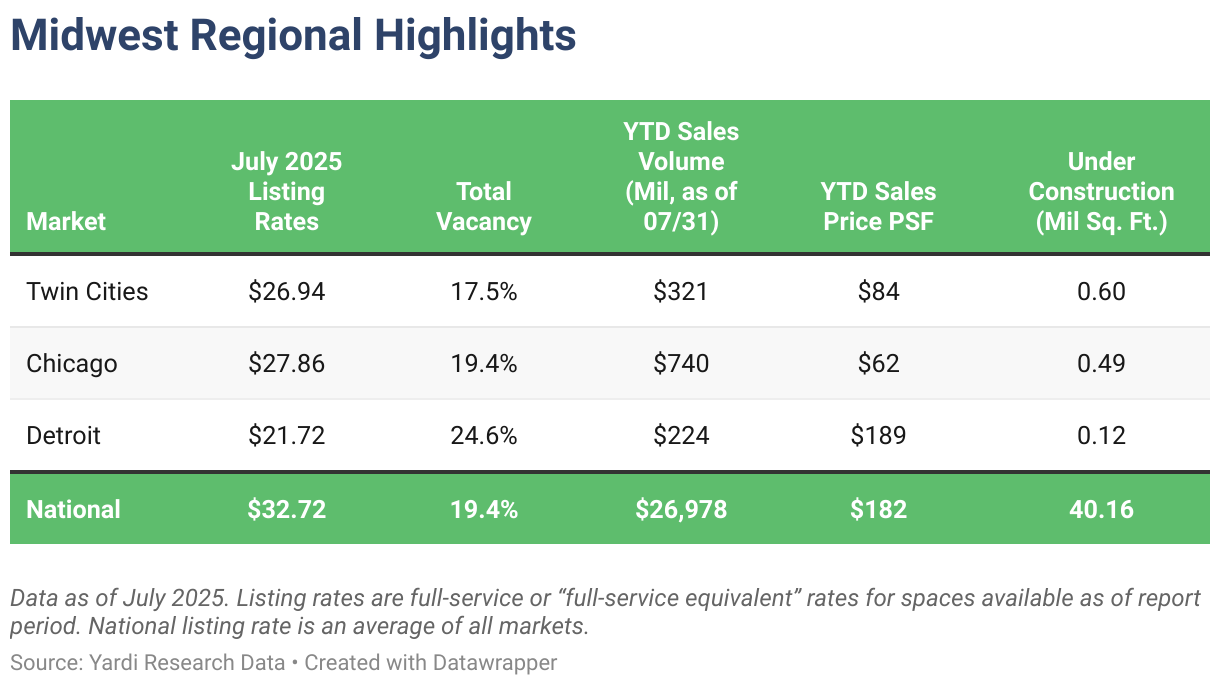
The supply pipeline across Midwestern U.S. markets remained rather modest in July with most construction activity occurring in the Twin Cities (roughly 600,000 square feet of office space in development), followed by Chicago, where there was less than 500,000 square feet of office space under construction in properties larger than 25,000 square feet.
Southern Markets
Miami Leads in Leasing Rate as Washington, D.C. Tops YTD Office Sales
Office asking rents in half of the top Southern U.S. markets we analyzed were above the national average of $32.72 per square foot in July. Namely, office space in Miami commanded the highest listing rates in the region — and the third-highest nationwide — at $57.30 per square foot. Austin, Texas, (nearly $46) and Washington, D.C. (roughly $41) were the only other markets in the region where asking office space rents were more than $40 per square foot.
On the other end of the scale, Houston office space listing rents averaged slightly less than $28 per square foot — the only one among the Southern U.S. markets included in this report where asking rents were below the $30-per-square-foot mark in July. The south Texas market also stood out for the most affordable office sale price, which averaged $86 per square foot for transactions closed since the start of the year. Even so, year-to-date sales here added up to more than $1.3 billion through July, which was the second-highest among Southern U.S. markets.
To that end, the largest office sales total in the South since the start of the year was in Washington, D.C., where nearly $3.4 billion worth of properties changed hands during the first seven months of the year. Aside from Houston, only two other markets in the region exceeded $1 billion in office sale totals so far this year — Dallas (nearly $1.3 billion) and Atlanta (a little more than $1 billion). Then, on a per-square-foot basis, Dallas office space commanded the second-highest price tag in the region during that same time ($218).
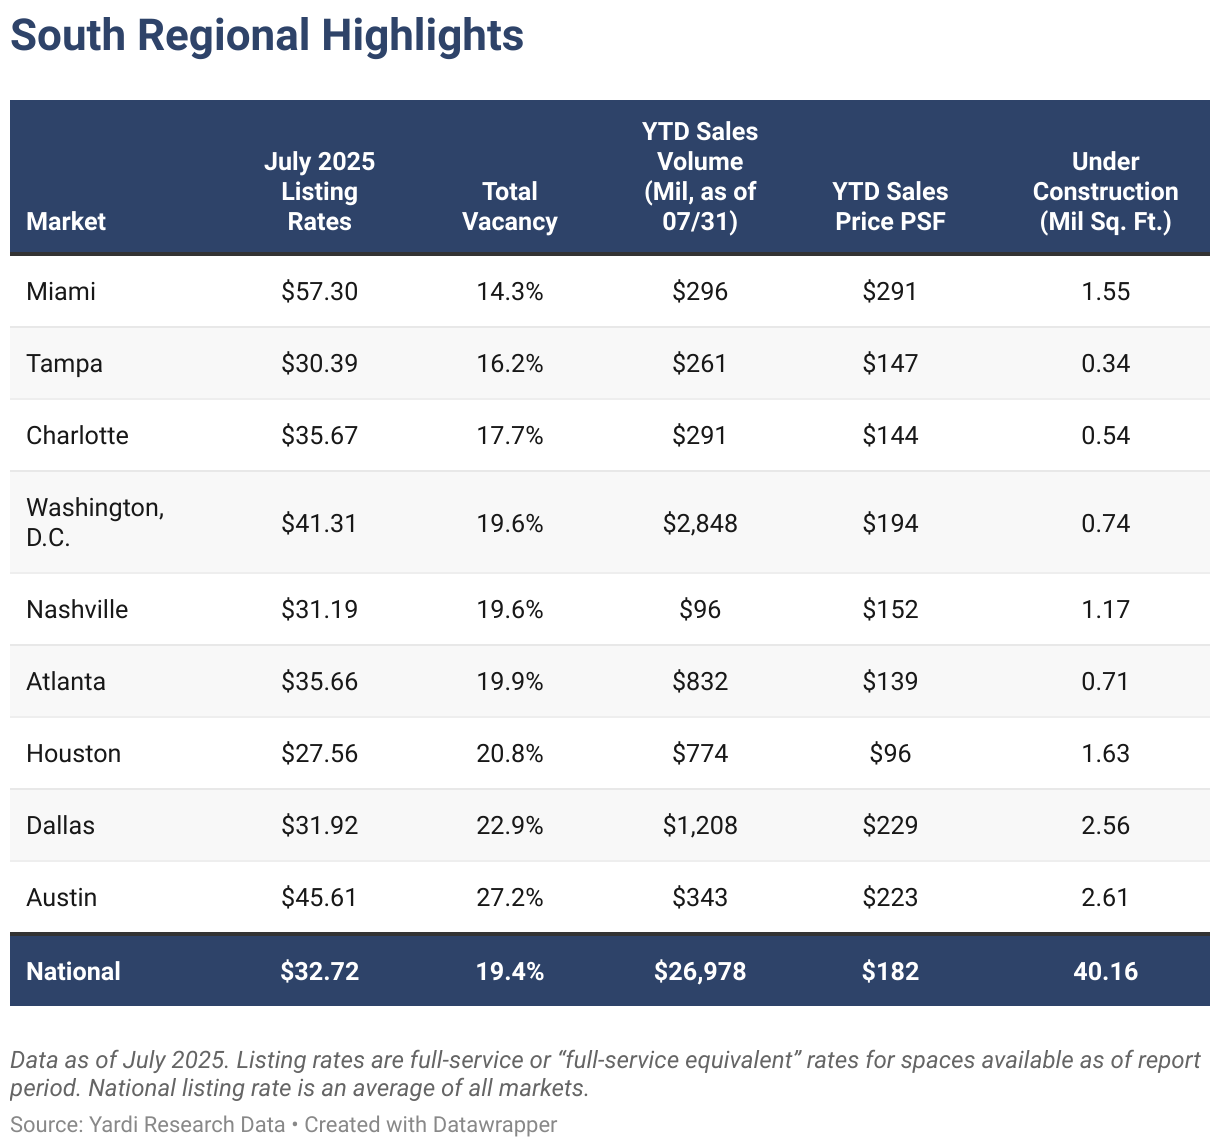
Texas markets continued to account for most of the development activity in the region as more than half of the nearly 12 million square feet of office space currently under construction across top Southern U.S. markets was concentrated in Austin, Texas (2.61 million square feet); Dallas-Fort Worth (2.56 million); and Houston (1.63 million).
The same three markets also had the largest office vacancy rates in the region last month and were the only three in this geographical group to see vacancy above 20% in July — Austin at 27.2%, followed by Dallas-Fort Worth with nearly 23% and Houston at roughly 21%.
Northeastern Markets
Manhattan, N.Y., Maintains Lowest Vacancy in Region as Construction Picks Up
In July, Manhattan, N.Y., office space had the highest occupancy among the largest Northeastern U.S. markets we surveyed: The vacancy rate here was 15.2% in July following a 130-bps decrease year-over-year. At the same time, developers here had nearly 2.6 million square feet under construction, which was a 1-million-square-foot pick-up in construction activity from the previous month.
Yet, Boston maintained its comfortable lead ahead of Manhattan in terms of office supply as projects under construction here added up to nearly 5.6 million square feet of office space in July. In fact, vacancy in the New England powerhouse was only slightly higher than in Manhattan (16% in July), whereas the vacancy rates were closer to (but still below) the national average of 19.4% in both New Jersey and Philadelphia.
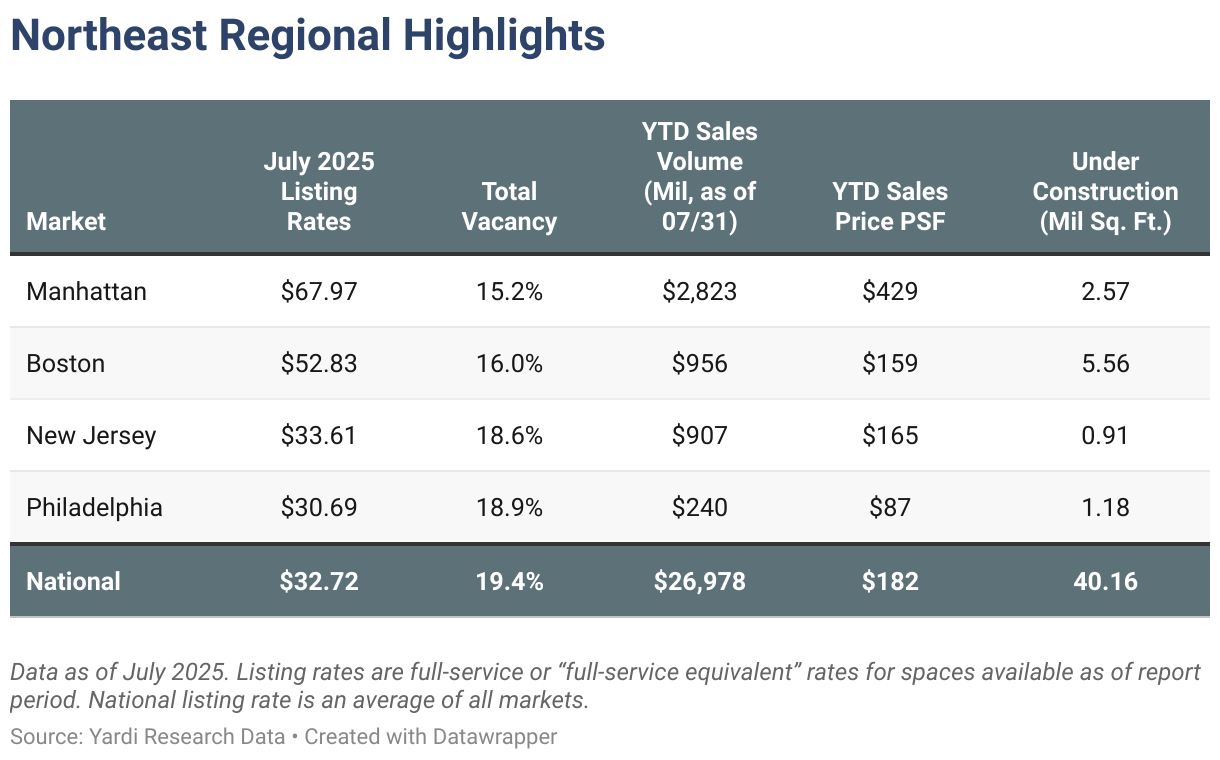
New York City’s tallest borough topped the stats in all other respects: Office space in Manhattan asked the highest listing rates in the region and nationwide (nearly $68); commanded the highest sale price per square foot ($422); and saw more than $3 billion worth of office properties change hands since the start of the year.
Office-Using Employment
Office Jobs Still Shifting Between Sectors as Charlotte, N.C., & Corporate Relocations Boost Employment Stats
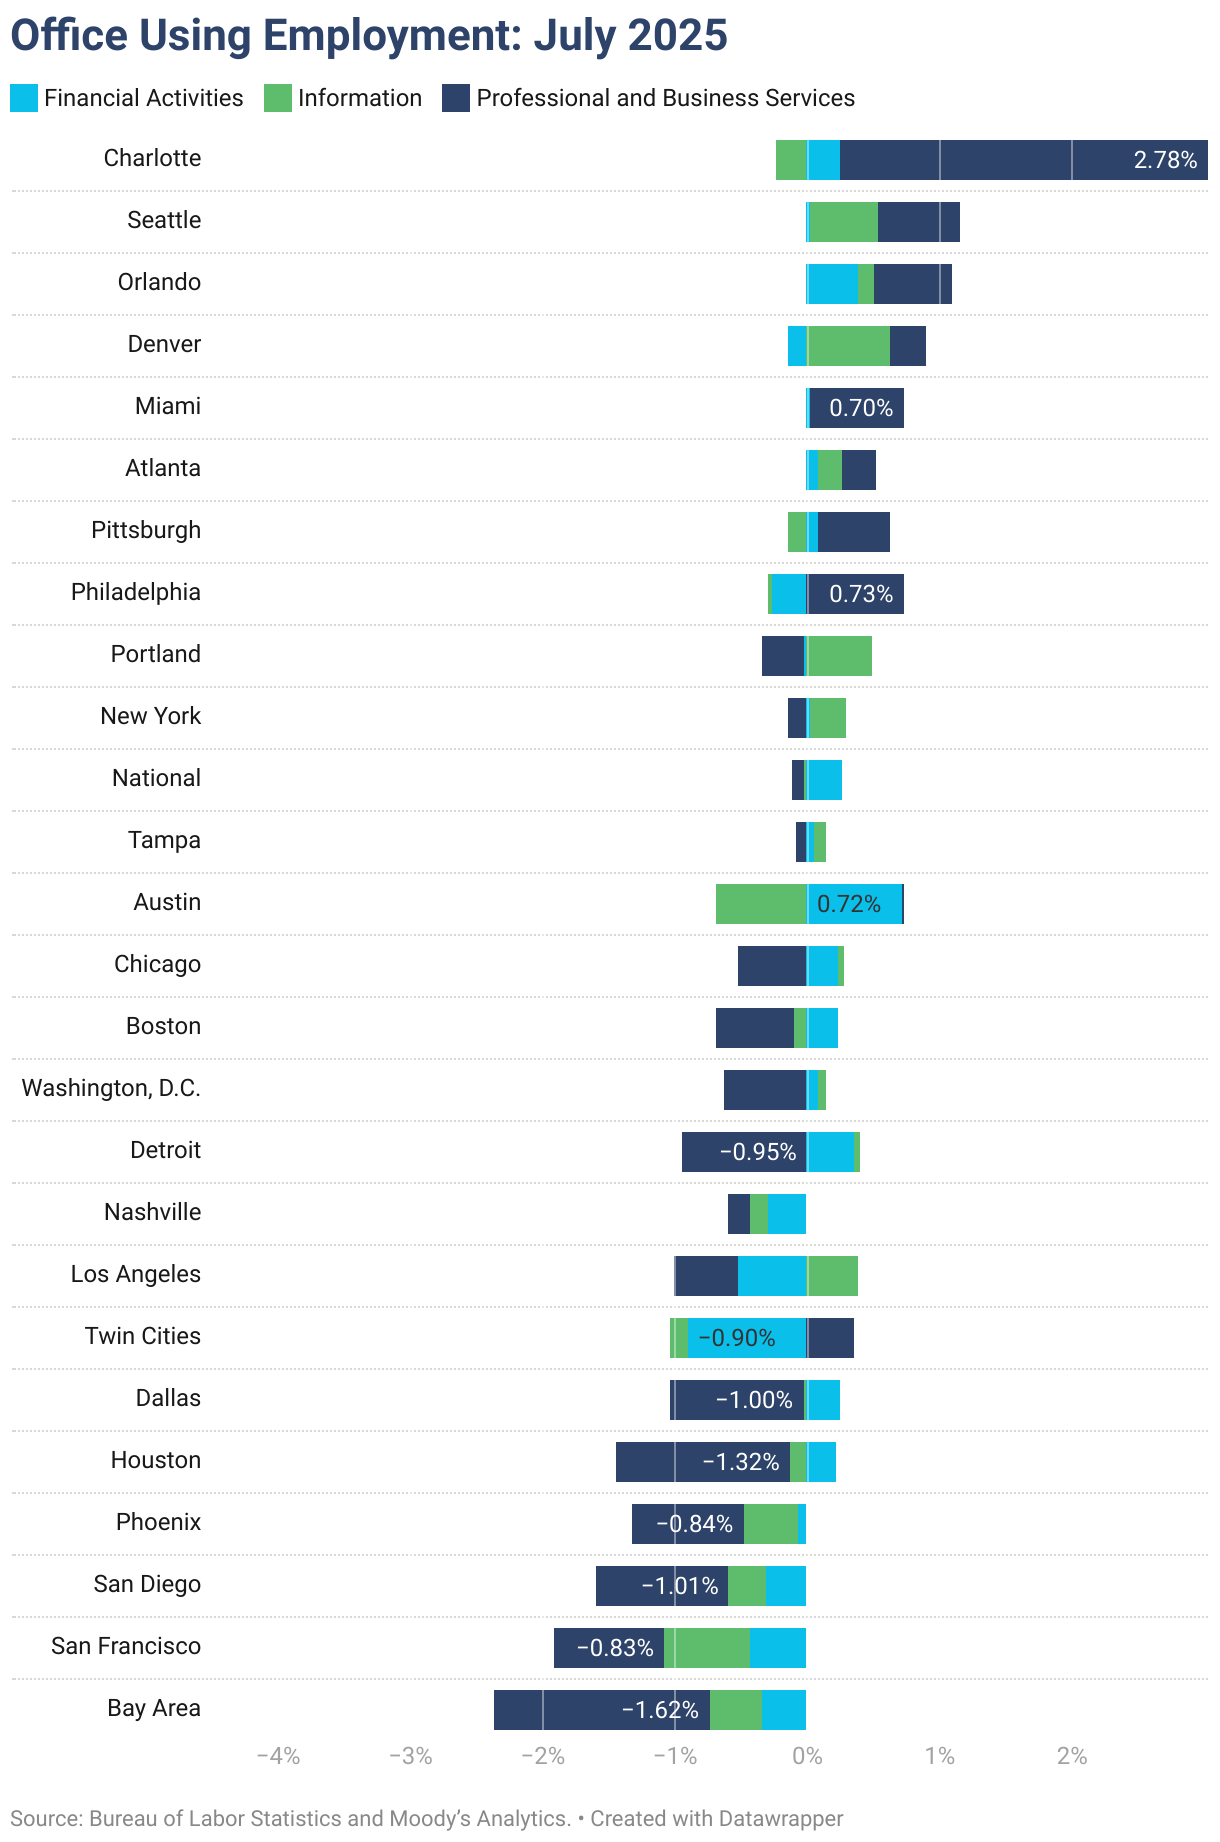
The latest Bureau of Labor Statistics data showed that office-using sectors of the labor market lost a combined 1,000 jobs in July — a decline that appears to have been mostly led by the professional and business services sector with some losses also accountable to the information sector. That said, the financial activities sector was riding high on a positive trend compared to previous estimates.
Overall, office-using sectors gained 41,000 jobs nationally year-over-year — a 0.1% increase — while total non-farm employment grew 1% during the same time period.
Meanwhile, metro-level data (lagging behind the national release) showed that only 12 of the top 25 markets saw growth in June, compared to the year before. Among them, Charlotte, N.C., led the pack with nearly 3% Y-o-Y growth. Estimates place most of Charlotte’s office employment growth in the professional and business services sector due to several major corporations relocating to the area.
Seattle followed Charlotte with 1.2% growth in office-using employment, while Orlando, Fla., was third (1.1%).
Methodology
This report covers office buildings that are 25,000 square feet or larger. Listing rate and occupancy information was based on Yardi Research data.
- Listing rates are full-service rates or “full-service equivalent” for spaces that were available as of the report period.
- Vacancy refers to the total square feet vacant in a market (including subleases) divided by the total square feet of office space in that market. Owner-occupied buildings are not included in vacancy calculations. For reporting purposes, A and A+/trophy buildings were combined.
Stages of the supply pipeline:
- Planned — Buildings that are currently in the process of acquiring zoning approval and permits, but have not yet begun construction.
- Under Construction — Buildings for which construction and excavation has begun.
Office-Using Employment is defined by the Bureau of Labor Statistics as including the sectors Information, Financial Activities, and Professional and Business Services. Employment numbers are representative of the Metropolitan Statistical Area and do not necessarily align exactly with CommercialCafe market boundaries.
Sales volume and price-per-square-foot calculations for portfolio transactions or those with unpublished dollar values were estimated using sales comps based on sales that were similar in terms of the market and submarket; use type; location and asset ratings; sale date; and property size.
Market boundaries in the CommercialCafe office report coincide with markets defined in the CommercialCafe Markets Map and may differ from regional boundaries defined by other sources.
Fair Use & Redistribution
We encourage and freely grant you permission to reuse, host, or repost the research, graphics, and images presented in this article. When doing so, we kindly ask that you credit our research by linking to CommercialCafe.com or this page so that your readers can learn more about this project, the research behind it, and its methodology. For more in-depth, customized data, please contact us at [email protected].
link